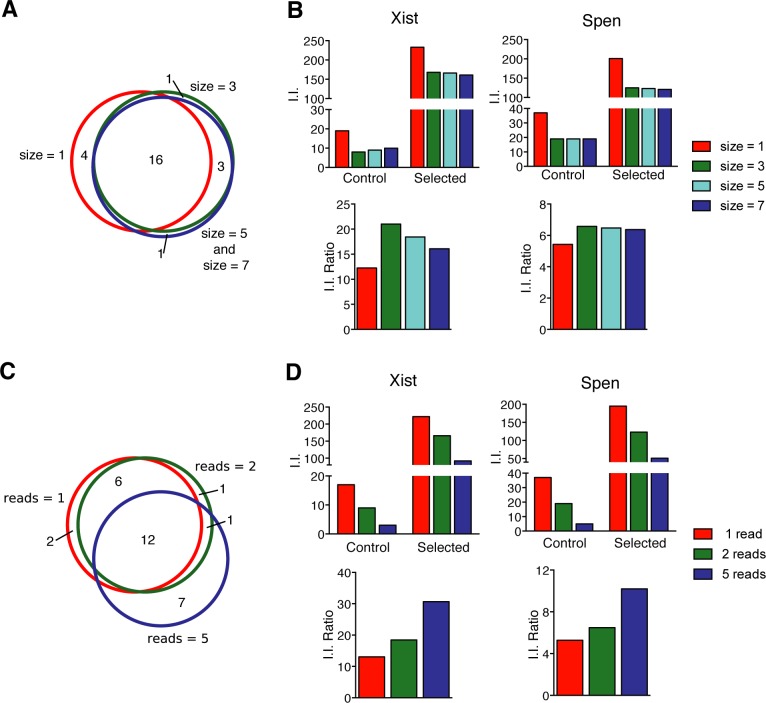
Fig 4. Effects of analysis parameters on candidate ranking.
(A-B) Effects of variation in the window size applied to define I.I. in candidate selection. (A) Venn-diagram comparing the 20 top candidates. (B) Effect of window size on I.I. for the experimentally validated candidates Xist and Spen. The number of I.I. and the ratios of I.I. in Selected over Control samples for different window sizes are shown. (C-D) Effects of the read number threshold for I.I. on candidate identification. (C) Venn-diagram comparing the 20 top candidates. (D) Insertion number (I.I.) of Xist and Spen using different thresholds.

