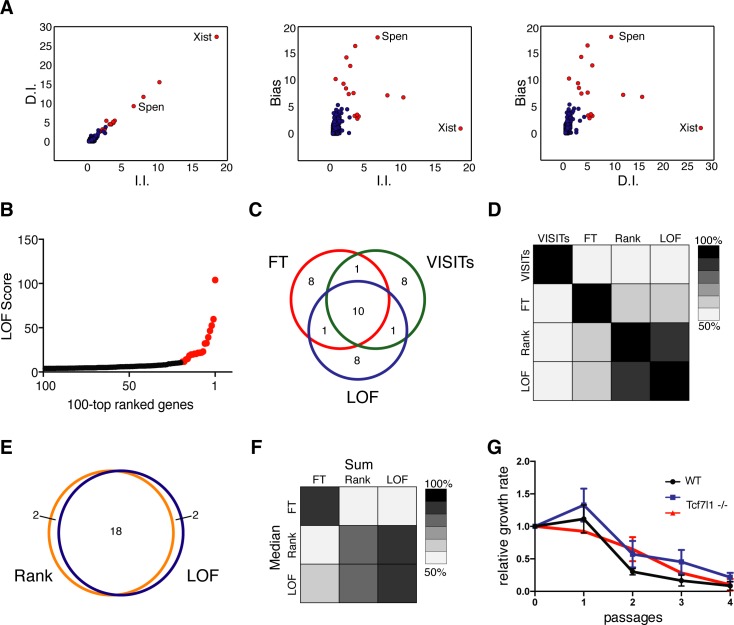
Fig 5. Comparison of candidate selection algorithms.
(A) Visualization of fold enrichment of I.I. and D.I. (left panel), I.I. and Bias (Central panel), and D.I. and Bias (right panel) during selection. The 20 top ranked genes by the LOF algorithm are shown in red, and the validated candidates Xist and Spen are annotated. (B) LOF score of the first 100 genes of the candidate list plotted against position. The 20 top ranked genes are shown in red. (C) Venn-diagram showing overlap of the 20 top ranked candidates identified by FT, VISITs, and LOF. (D) Heatmap showing correlation between candidate lists of FT, VISITs, Rank and LOF. 20 top candidates were considered, colour coding indicates the percentage of genes that are in common. (E) Venn-diagram showing 20 top candidates using Rank and LOF algorithms. (F) Heatmap showing overlap of the 20 top candidates by FT, Rank, and LOF algorithms using either the entire dataset (Sum) or the median of 7 replicates (Median). Colour coding as in panel D. (G) Relative growth rate of 2 Tcf7l1 deficient ESC clones (red and blue) and WT control ESCs (black) after Xist induction with Doxycycline is plotted. Error bars represent standard deviation (n = 3).

