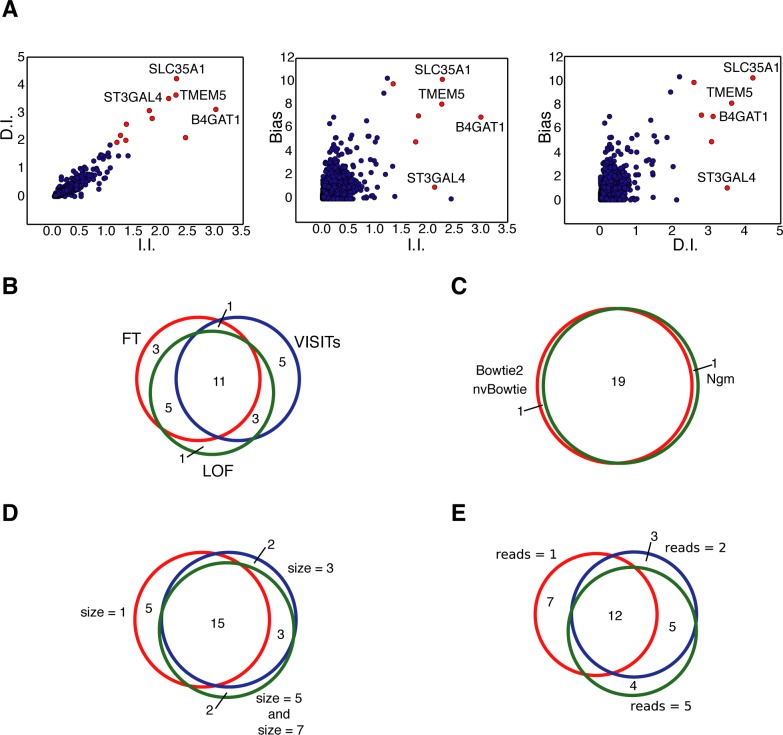
Fig 6. Benchmarking HaSAPPy on a screen for resistance to Lassa virus entry.
(A) Visualization of parameter distribution for the LOF algorithm. For each gene the fold enrichment after selection in I.I. and D.I. (left panel), I.I. and Bias (Central panel) and D.I. and Bias (right panel) is plotted. The 12 top ranked genes by the LOF are marked in red, and validated candidates are annotated. (B) Venn-diagram comparing 20 top candidates predicted by the FT, VISITs and LOF algorithms. (C) Venn-diagram showing overlap of the 20 top ranked candidates using Bowtie2, nvBowtie and NextGenMap (Ngm) for read alignment. (D) The Venn-diagram shows the overlap of the 20 top candidates using different window sizes, and (E) using different read number thresholds for including an I.I. in the analysis.

