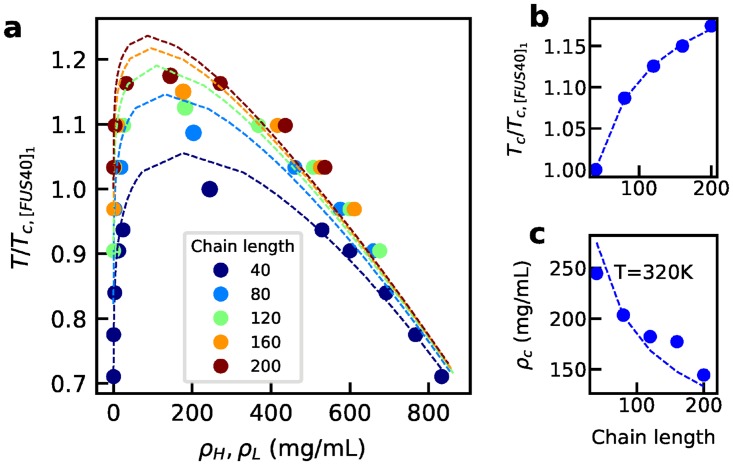
Fig 8. Phase separation of truncated FUS fragments of different lengths.
a) Phase diagram for each peptide. Dashed lines show the fitting to binodal of Flory-Huggins theory. b) The critical temperature. Dashed lines show the fitting using relation with prefactor as the fitting parameter. c) The critical concentration. Dashed lines show the fitting using relation with prefactor as the fitting parameter. Temperatures are scaled by the critical temperature of [FUS40]1. The corresponding slab density profiles are provided in S18 Fig.

