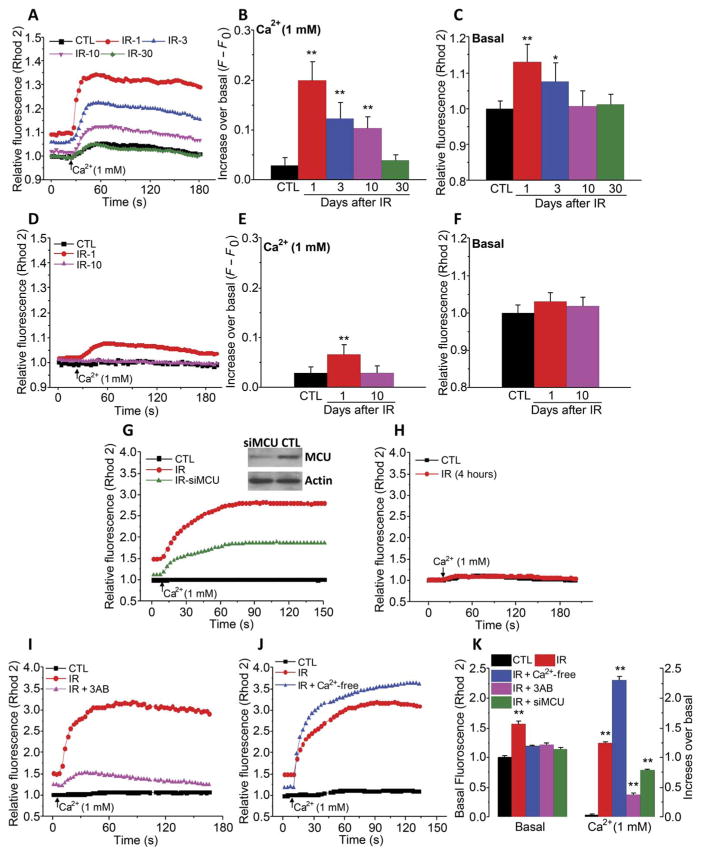
Fig. 2. Irradiation causes a TRPM2- and MCU-dependent increase in [Ca2+]mt.
(A to F) [Ca2+]mt was monitored in acinar cells from nonirradiated mice (control) and from TRPM2+/+ (A to C) and TRPM2−/− mice (D to F) on 1, 3, 10, and 30 days after 15-Gy radiation treatment (IR-1, IR-3, IR-10, and IR-30) by measuring Rhod2 fluorescence in cells maintained in Ca2+-free medium and after Ca2+ was added to the external medium (A and D). Quantitation of data in (A) and (D) is shown for the peak increase in [Ca2+]i after readdition of Ca2+ (B and E) and basal [Ca2+]i in Ca2+-free medium (C and F) (CTL, 188 acini from four TRPM2+/+ mice and 224 acini from four TRPM2−/− mice; IR-1, 214 acini from three TRPM2+/+ mice and 212 acini from three TRPM2−/− mice; IR-3, 210 acini from three TRPM2+/+ mice and 200 acini from three TRPM2−/− mice; IR-10, 204 acini from three TRPM2+/+ mice and 210 acini from three TRPM2−/− mice; and IR-30, 204 acini from three TRPM2+/+ mice). *P < 0.05 and **P < 0.01, comparing the indicated value to its respective control value using unpaired t test. (G and H) A similar protocol was used to measure [Ca2+]mt in control and irradiated HSG cells with or without siMCU treatment 1 hour (G) and 4 hours (H) after irradiation (180 to 210 cells from three independent experiments). Inset: Western blot in (G) shows MCU abundance in control and siMCU-treated cells (representative of results in three independent experiments). (I to K) Similar measurements were made in HSG cells treated with 3AB before irradiation (180 to 220 cells from three independent experiments) or maintained under Ca2+-free conditions during and 1 hour after irradiation (200 to 212 cells from three independent experiments). **P < 0.01, the indicated value compared to its respective control using unpaired t test.

