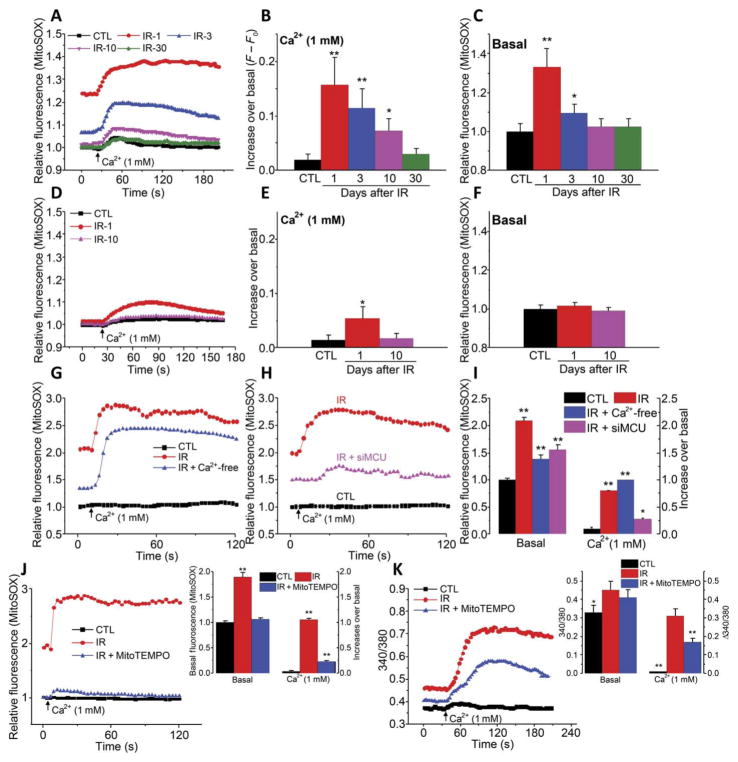
Fig. 3. Radiation treatment causes a TRPM2 and MCU-dependent increase in mitochondrial ROS.
(A to F) Mitochondrial ROS as assessed by measuring MitoSOX fluorescence in acini from control and irradiated TRPM2+/+ (A to C) and TRPM2−/− (D to F) on days 1, 3, 10, and 30 after irradiation, as indicated (IR-1, IR-3, IR-10, and IR-30). Fluorescence changes were measured in cells maintained in Ca2+-free medium and after Ca2+ was added to the external medium (A and D). Quantitation of data from (A) and (D) is shown for peak increase after readdition of Ca2+ (B and E) and basal in Ca2+-free medium (C and F) (CTL, 188 to 256 acini from five TRPM2+/+ mice and TRPM2−/− mice each; IR-1, 200 acini from three TRPM2+/+ mice and 212 acini from three TRPM2−/− mice; IR-3, 210 acini from three TRPM2+/+ mice and 200 acini from three TRPM2−/− mice; IR-10, 214 acini from three TRPM2+/+ mice and 218 acini from three TRPM2−/− mice; and IR-30, 210 acini from three TRPM2+/+ mice). *P < 0.05 and **P < 0.01, comparing the value with its respective control, unpaired t test. (G and H) A similar protocol was used to measure mitochondrial ROS in control HSG cells (G and H), in irradiated HSG cells maintained under Ca2+-free conditions during and 1 hour after irradiation (G), and in irradiated HSG cells with or without siMCU (H) [200 to 260 cells from four independent experiments in (G) and 210 to 240 cells from four independent experiments in (H)]. (I) Quantitation of basal and peak changes in fluorescence after Ca2+ addition. (J and K) HSG cells were treated with MitoTEMPO before irradiation. Data from control, irradiated, and irradiated MitoTEMPO cells are shown (220 cells in each group in three independent experiments). *P < 0.05 and **P < 0.01, comparing each indicated value with its respective control, unpaired t test (I to K).

