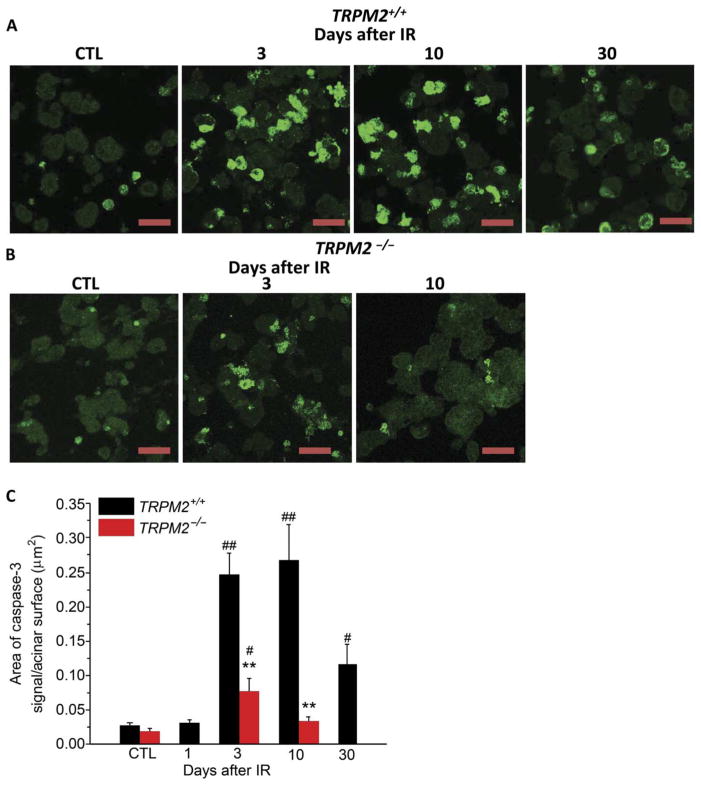
Fig. 5. TRPM2 channel contributes to activation of caspase-3 after irradiation.
(A and B) Immunofluorescence staining of active caspase-3 in submandibular acinar cells. Anti–active caspase-3 antibody staining in acinar cells from TRPM2+/+ mice (A) (CTL, four TRPM2−/−mice and four TRPM2+/+ mice; IR-3 and IR-10, six TRPM2−/− mice and six TRPM2+/+ mice; and IR-30, four TRPM2−/− mice and four TRPM2+/+ mice). (B) Anti–active caspase-3 antibody staining in acinar cells from TRPM2−/− mice (CTL, three TRPM2−/− mice and three TRPM2+/+ mice; IR-3 and IR-10, six TRPM2−/− and six TRPM2+/+ mice). Scale bars, 30 μm (A and B). The area of caspase-3 signal/total surface acinar area is shown in (C). **P < 0.01 compares TRPM2+/+ mice with TRPM2−/−mice group at the same time point after radiation using χ2 test; #P < 0.05, ##P < 0.01 compares the values to their respective control, χ2 test; the number of mice for each is shown in parentheses above.

