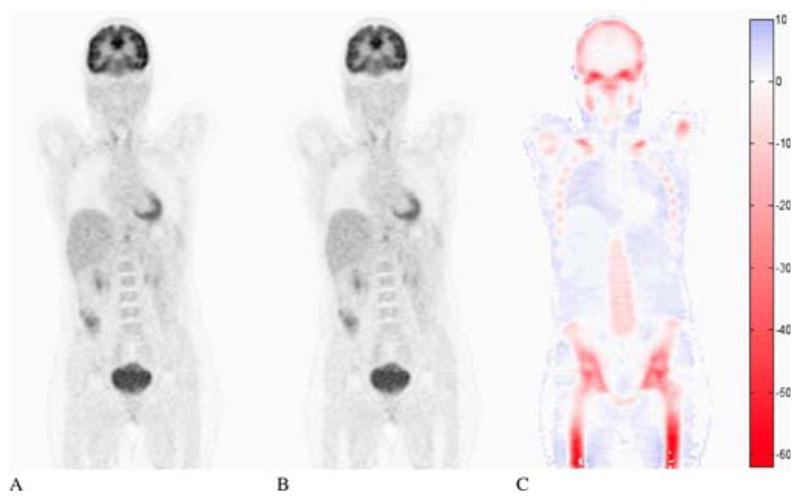
Fig. 3.

Image quantification bias when bone is not taken into account: PET image reconstructed with CT-AC (A) or with the same CT-AC but with all bone structures set to the attenuation value of soft tissue (B) and relative differences in percentage (C). Figure originally from Hofmann, M., et al. (2009). “Towards quantitative PET/MRI: a review of MR-based attenuation correction techniques.” Eur J Nucl Med Mol Imaging 36 Suppl 1: S93–104.
