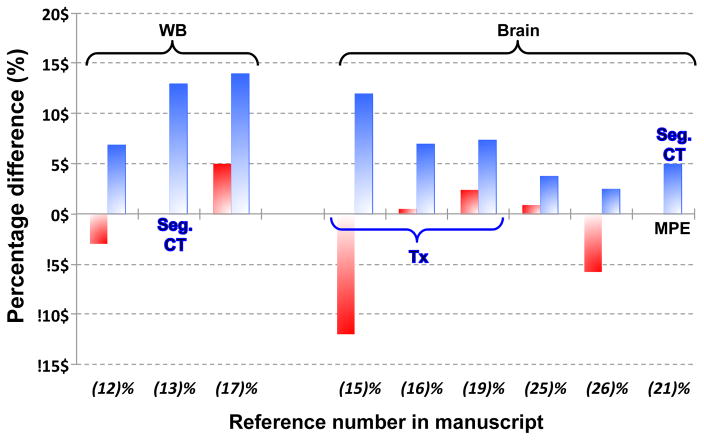
Fig. 6.
Comparison of Minimum (red) and Maximum (blue) Percentage differences of PET reconstructed images versus the gold-standard, CT-AC, unless explicitly written otherwise: Tx = Transmission-based AC; Seg. CT = Segmented CT AC. Where available MPE = Mean Percentage Error replaces maximum percentage differences. Figures taken from literature where specific concrete values were available.

