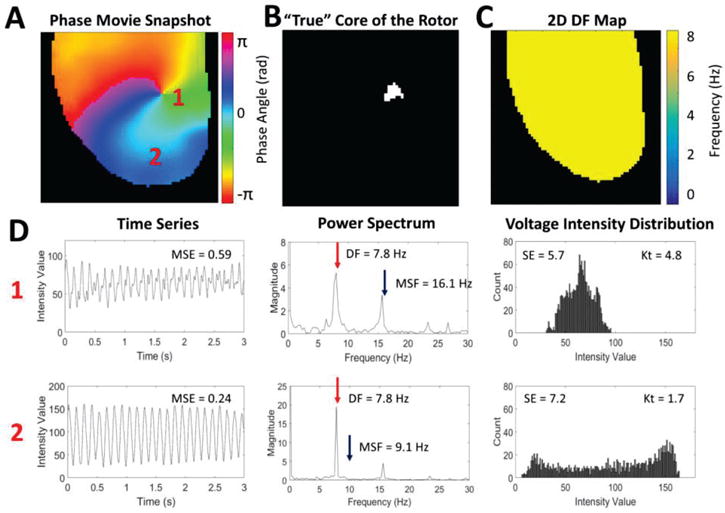
Fig. 1.

An example of a single stationary rotor from optical mapping of a rabbit heart. (A) Snapshot of the phase movie of the single stationary rotor with the depolarizing wave front shown in red. The pivot point and periphery of the rotor are identified by ‘1’ and ‘2’ respectively. (B) Pixel map showing the “true” location of the pivot point identified from the phase movie. (C) 2D DF map generated from the single stationary rotor showing a single DF of 7.8 Hz. (D) Representative examples of the time series, power spectrums, and voltage intensity distributions from the pivot point (location ‘1’) and periphery (location ‘2’) of the rotor demonstrating differences in signal characteristics.
