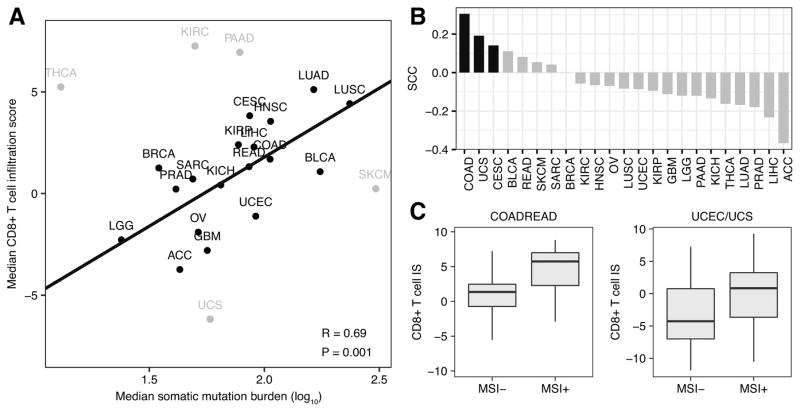
Figure 3.
Mutation burden and CD8+ T cell infiltration. A, Scatterplot of median somatic mutation number per tumor sample across 23 cancer types (log10 scale) compared with each tumor’s corresponding median CD8+ T cell infiltration score. Pearson correlation coefficient and least-squares regression line presented were calculated excluding the five outlier tumor types in gray. B, Individual Spearman correlation coefficients representing the associations between somatic mutation number and CD8+ T cell infiltration score in 23 different tumor types. Black bars represent statistically significant associations (P < 0.1). C, Box plots comparing the CD8+ T cell infiltration score (CD8+ T cell IS) in MSI− versus MSI+ samples. Left boxplot makes comparison in colorectal adenocarcinoma (COADREAD) samples. Right boxplot makes comparison in combined cohort of uterine corpus endometrial carcinoma (UCEC) and uterine carcinosarcoma (UCS) samples. Each box spans quartiles, with the lines representing the median correlation coefficient for each group. Whiskers represent absolute range excluding outliers. All outliers were included in the plot. TCGA abbreviations for each cancer type are listed in Supplementary Table S1.

