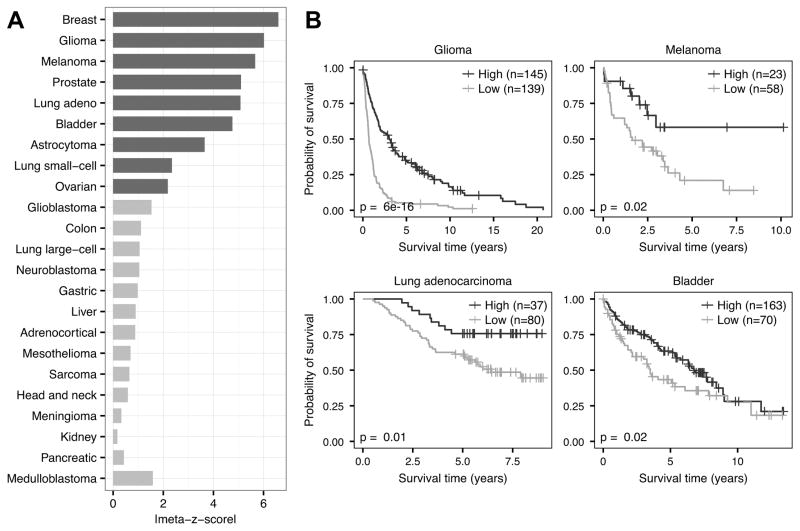
Figure 4.
Survival meta-analysis of CD8+ T cell infiltration. A, Meta-z-score absolute values indicating prognostic associations of CD8+ T cell infiltration in 23 different tumor types comprising 18,190 samples. Cancers were ranked by weighted meta-z-score. Dark gray bars indicate a weighted absolute meta-z-score >1.96, whereas light gray bars indicate a weighted meta-z-score whose absolute value is <1.96. B, Kaplan–Meier plots depicting the survival probability over time for samples with high (dark gray) and low (light gray) CD8+ T cell infiltration scores. Datasets tested include GSE16011 (glioma), GSE8401 (melanoma), GSE13213 (lung adenocarcinoma), and GSE5479 (bladder). For all Kaplan–Meier plots, samples were stratified into high and low groups based on their infiltration score distributions (thresholds available in Supplementary Figure S4). P values were calculated using the log-rank test. Vertical hash marks indicate censored data.

