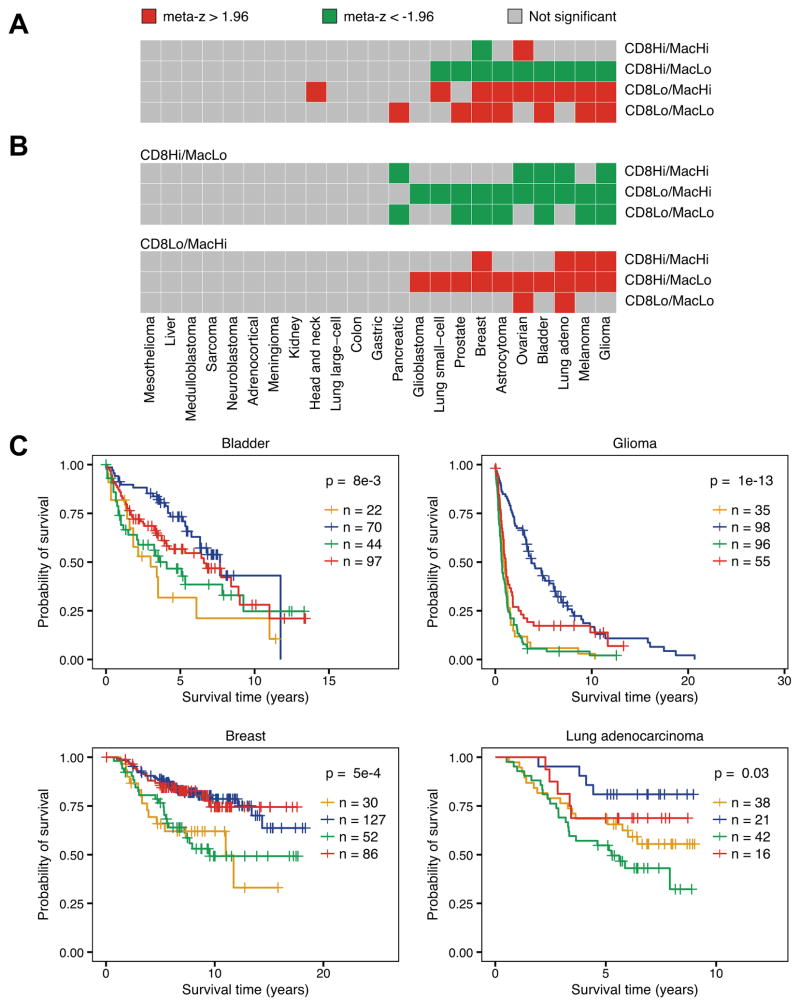
Figure 5.
Effect of CD8+ T cell and macrophage infiltration on patient survival. a Weighted meta-z-scores from binary Cox proportional hazard models comparing the indicated class to the three remaining classes. b Weighted meta-z-scores from binary Cox proportional hazards models comparing CD8 T high/macrophage low (top) and CD8 T low/macrophage high (bottom) to the indicated classes. For all heatmaps, high/low status for each cell type was determined using median infiltration score for CD8+ T cells and macrophages. Red boxes indicate cancers where indicated class had significantly worse survival compared to other classes (meta-z > 1.96), green boxes indicate significantly improved survival compared to other classes (meta-z < -1.96), and gray boxes indicate no statistical association. c Kaplan-Meier plots depicting the survival distributions of all four classes: CD8+ T low/macrophage low (orange), CD8+ T high/macrophage low (blue), CD8+ T low/macrophage high (green), and CD8+ T high/macrophage high (red). Colors correspond to the classes as noted in a. Datasets tested include GSE5479 (bladder), GSE16011 (glioma), van de Vijver et al (breast), and GSE13213 (lung adenocarcinoma). For all Kaplan-Meier plots, samples were stratified into high and low groups based on their infiltration score distributions (thresholds available in Supplementary Figures S6 and S7). P-values were calculated using the log-rank test and indicate that at least one curve is significantly different from the rest. Vertical hash marks indicate censored data.

