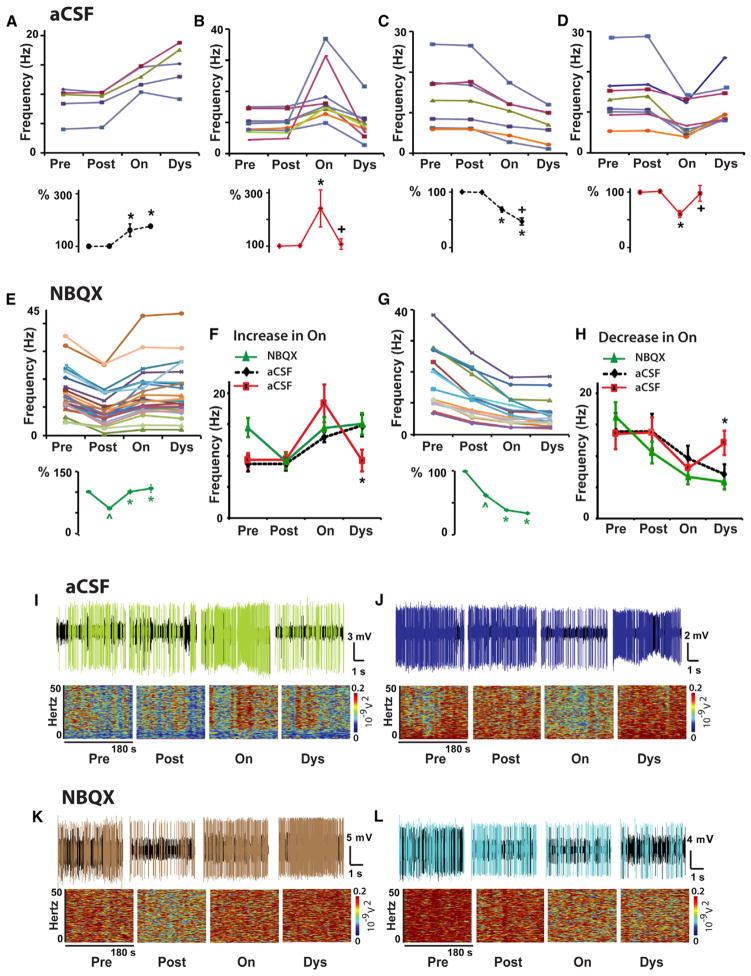
Figure 3. AMPAR Antagonist Injection at the Site of SPN Recording Reduced the Basal Activity and Stabilized DA Responses in the Parkinsonian Primate.
(A–D) The same control data as presented in Figures 2A–2D, respectively, for comparison with results obtained with the AMPAR antagonist. See Figure 2 for details.
(E–H) AMPAR antagonist tests. Firing frequency changes of each SPN as described for control tests are shown in (E) and (G) after local injection of NBQX. In each SPN, differences between Pre and Post, and between Post and On are significant at p < 0.01. Differences between On and Dys were non-significant (see also Figure S3). SPN stable responses after NBQX are compared to control tests in (F) and (H). Total SPNs, 43; units with activity increase in the “on” state, 26; units with activity decrease, 17.
In each group analysis, ^p < 0.01 versus baseline, *p < 0.01 versus Post aCSF or NBQX injection, and +p < 0.01 versus the “on” state (ANOVAs for repeated measure followed by Bonferroni’s correction). In (F) and (H), *p < 0.05 between NBQX and aCSF unstable response (one way ANOVAs). Error bars indicate SEM (n = 5 primates; see Table S1).
(I–L) Examples of SPN unstable responses in aCSF tests ([I and J], same examples as in Figures 2I and 2J for comparison) or stable responses in NBQX tests (K and L). Short (5 s) spike trains and spectrograms for the segment duration (180 s) are shown for each segment, Pre, Post, On, and Dys. The unit activity is colored after spike sorting as the corresponding curve in the frequency graphs B, D, E and G.

