
Figure 2.
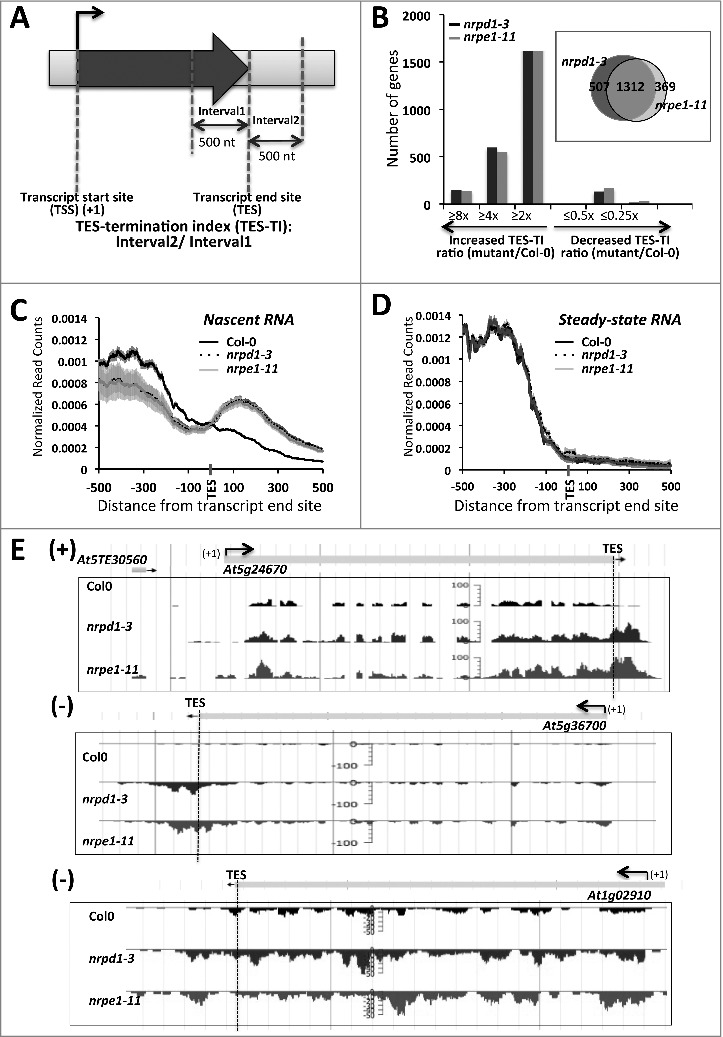
Genes with increased read density downstream of their transcript end sites (TES) in pol IV or pol V mutant plants. (A)Schematic for calculating the TES-termination index (TES-TI). (B) Histogram showing the number of genes with increased or decreased TES-TI values in pol IV or pol V mutant plants, relative to wild-type (Col-0) plants. (Insert in B) Venn diagram showing the overlap between genes with 2 fold or more increase in post-TES read density in pol IV (nrpd1–3) or pol V (nrpe1–11) plants relative to Col-0 plants. (C) Nascent RNA read-density plotted relative to TESs for the 1312 genes affected by both Pol IV and Pol V (see Venn diagram of panel B). (D) As in (C) but for steady-state RNA. For (C) and (D) shadings represent 95% confidence intervals. (E) Examples of protein-coding genes with increased read density downstream of the TES (marked with blue dashed vertical line) in pol IV (nrpd1–3) or pol V (nrpe1–11) mutants, displayed using JBrowse.