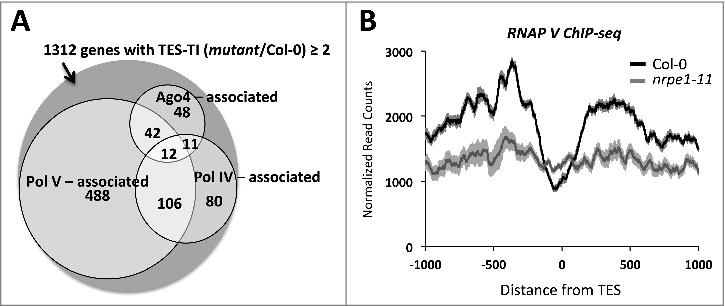
Figure 5.

Correspondence between genes with increased read density post-TES and RdDM pathway proteins. (A) Venn diagram showing number of genes with TES-TI (mutant/Col-0) ≥ 2 that overlap sites enriched by at least 1.5 fold over the corresponding background signal for Pol IV, Pol V or AGO4 proteins (Pol IV [44], Pol V [17], and AGO4 [45] ChIP-seq datasets) within 2 kb regions centered at their TES. (B) Pol V ChIP-seq read density for Col-0 and pol V mutant plants (Wierzbicki et al., 2012) (SRX156079 and SRX156080)) were plotted relative to TESs for the 1312 genes affected by both Pol IV and Pol V. Shadings represent 95% confidence intervals.
