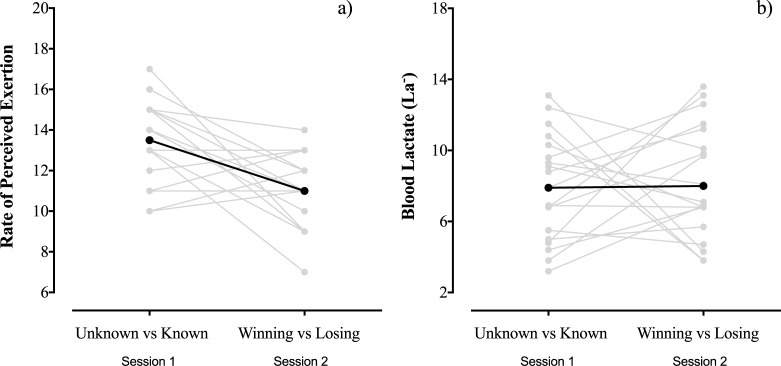
Fig 1. Characterisation of rate of perceived exertion and La- according to each testing session (Session 1: Unknowing and knowing the task duration; Session 2: Knowing the task duration and winning or losing).
Note: Grey solid lines indicate the responses of individual participants; black dotted lines indicate the group mean value.

