
Figure 2.
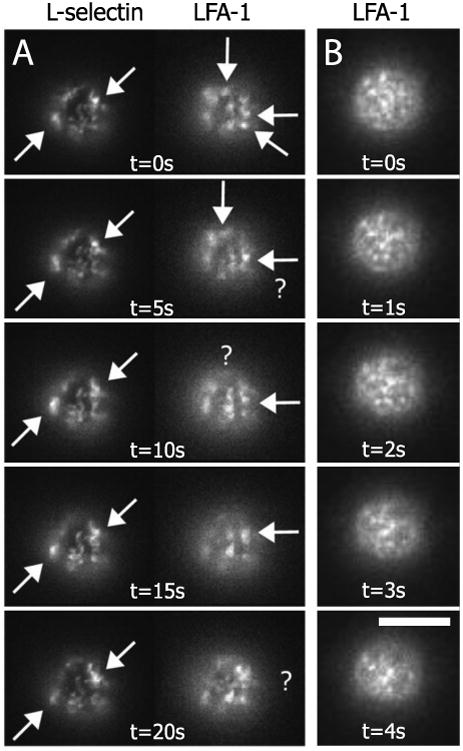
Time-lapsed epi-fluorescence images on the bottom surface of a human neutrophi. (A) CD62L and CD11a appear as distinct fluorescent patterns on the cell. CD62L features are more persistent in the image series compared to CD11a when imaged every 5 seconds. Arrows highlight specific domains that minimally diffuse. Domains that disappear between images are highlighted with a ‘?’. White bar is 5 microns. (B) CD11a imaged with greater temporal resolution on a different cell. Time-lapse movie available on-line.