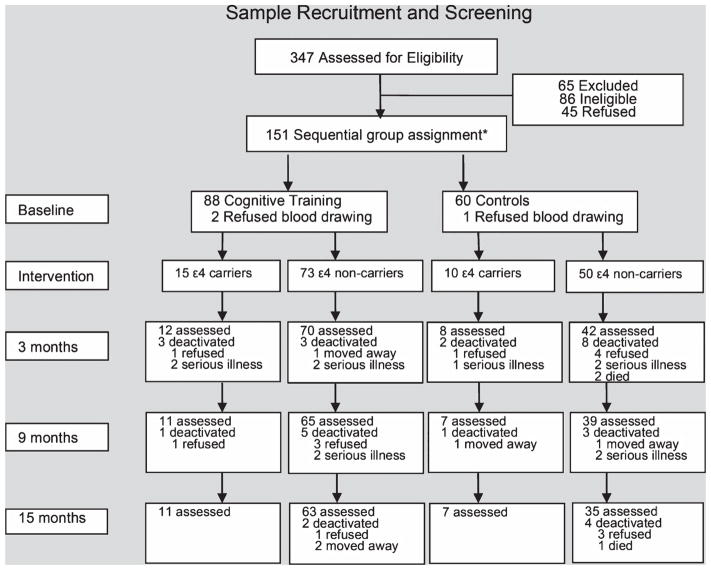
Fig. 1.
Sample recruitment and screening. Flowchart shows participant recruitment and screening at baseline, intervention, and 3, 9, and 15 months from baseline. *Individuals were sequentially assigned in groups of 50 to either the intervention or control group to avoid possible bias due to communication between intervention and control participants. For more details, see Materials and Methods section and [24].

