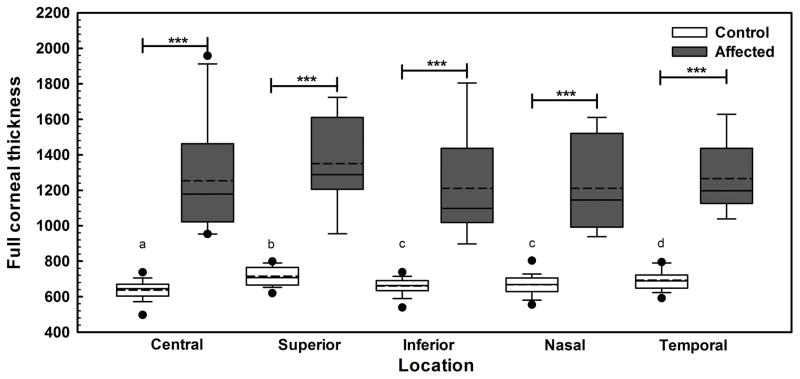
Fig. 1. Corneal thickness in 10 CED-affected dogs as measured by USP markedly differed in comparison to 19 unaffected controls.
At all 5 locations measured, CED-affected dogs had significantly greater corneal thickness in comparison to CED-unaffected dogs. Corneal thickness significantly differed between all locations in the CED-unaffected dogs but the inferior and nasal locations (P = 0.224). Box plots depict median (solid line), mean (dashed line), 25th and 75th percentiles, while whiskers show 10th and 90th percentiles; black circles indicate outliers. The P values were determined by a Kruskal Wallis ANOVA on ranks, ***P < 0.001 between CED-unaffected and affected dogs. a,b,c,dP < 0.005 between the different locations of CED-unaffected dogs.

