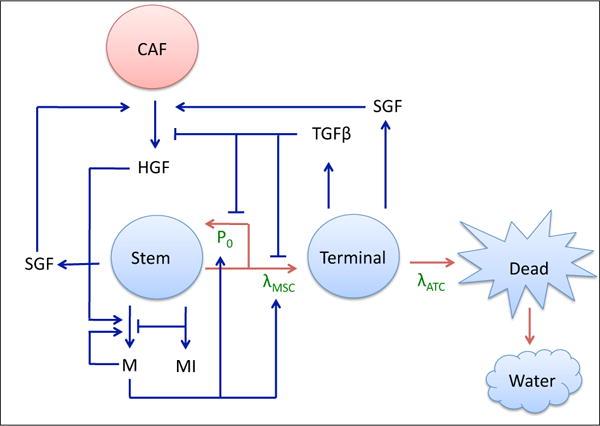
Figure 1.

Tumor-CAF interaction model. Tumor components (water and stem, terminal, and dead cells) are in blue, the host component (CAF) is in red, and associated growth factors and proteins (c-Met (M), c-Met inhibitors (MI), HGF, SGF, TGFβ, and SGF) are in black. Critical parameters are in green, red arrows represent tumor species interconversion, and blue arrows represent chemical production and action. Stem cells renew with probability P0 and divide with rate λMSC. Terminal cells die at a rate λATC and dead cells are converted to water. P0 is promoted by products of the c-Met signaling cascade (M) and HGF, and lowered by TGFβ, which is produced by the terminal cells. c-Met production, in turn, is promoted by itself and HGF, and lowered by c-Met inhibitors (MI). HGF production by CAFs is promoted by SGF, which are produced by stem and terminal cells.
