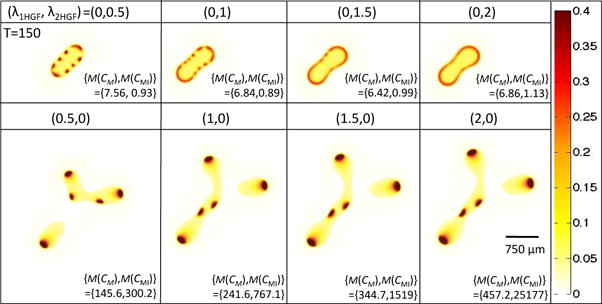
Figure 5.

Isolating the effects of and in Equations (18), (20), and (21) on stem cell distributions and concentrations of c-Met and c-Met inhibitors. Stem cell distribution is shown for T = 150 and ( , ) as indicated. The bottom right-hand corner of each simulation shows the maximum concentration of c-Met and c-Met inhibitor that is reached (the short-hand M(X) = max(X) is used). Note that δ1 and δ2 in Equations (5) and (6) are set to 0 to control for the HGF-induced effect on cell scatter.
