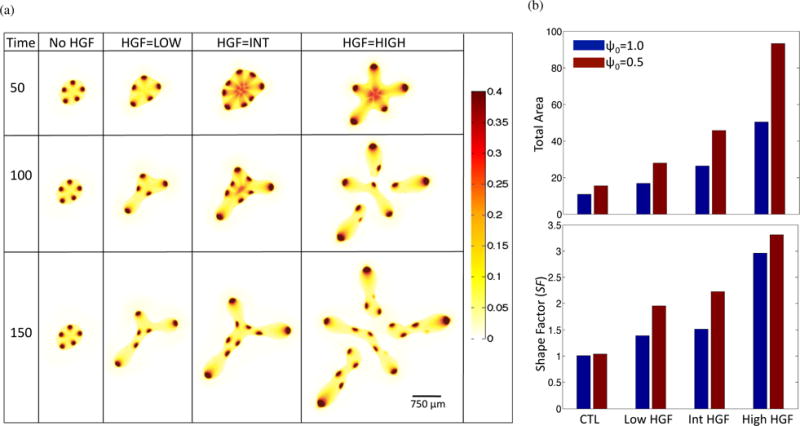
Figure 6.

Tumor evolution under decreased negative feedback. From the baseline simulation, ψ0 in Equation (13) is lowered from 1.0 to 0.5. (a) Stem cell distributions for increasing HGF dynamics. (b) Comparison of total area (top panel) and shape factor (SF) (bottom panel) between ψ0 = 1 (blue) and ψ0 = 0.5 (red) simulations at T = 150.
