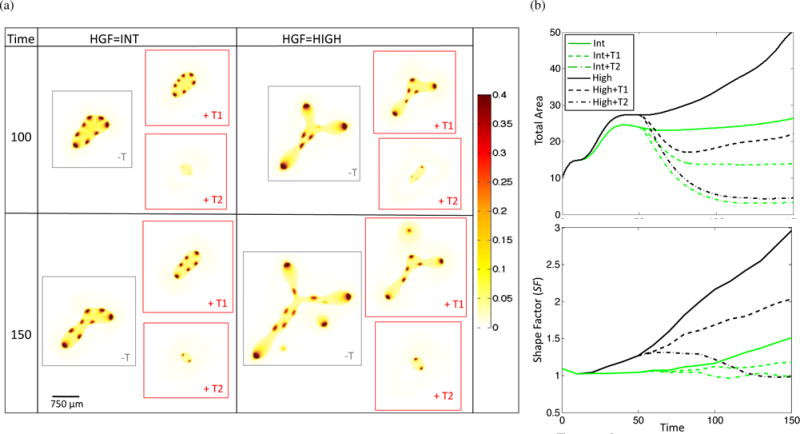
Figure 7.

Response of tumor to anti-HGF (T1, and lowered from 0.5 to 0.05) and anti-c-Met (T2, and lowered from 0.5 to 0.005 and ν0 lowered from 1.0 to 0.1) therapy applied at T = 50. (a) Representative stem cell fraction and (b) total area and shape factor for no therapy, T1, and T2 applied to int and high HGF tumors.
