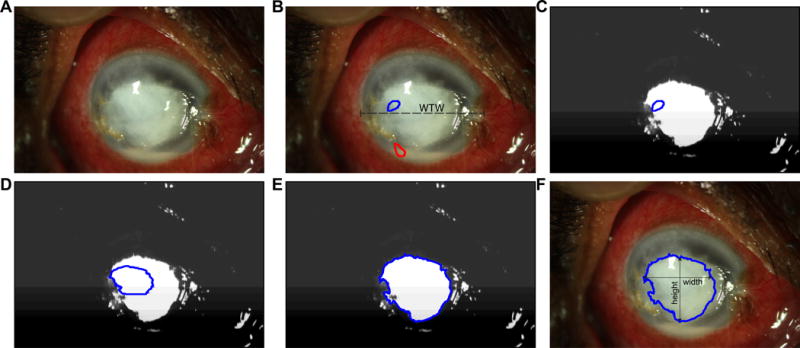
Figure 2.

QCM analysis pipeline: given a digital photograph of the corneal ulcer (A), the user draws a line to measure the horizontal white to white distance (WTW), and seed regions to denote the foreground (stromal infiltrate or epithelial defect, depicted in blue) and the background (clear cornea, depicted in red). A random forest tissue classifier generates a probability map of the foreground and background image (C). The probability map is used as a speed image for active contour evolution (D – E) and segmentation (F). The maximum vertical and horizontal distance is measured and recorded as the height and width, respectively.
