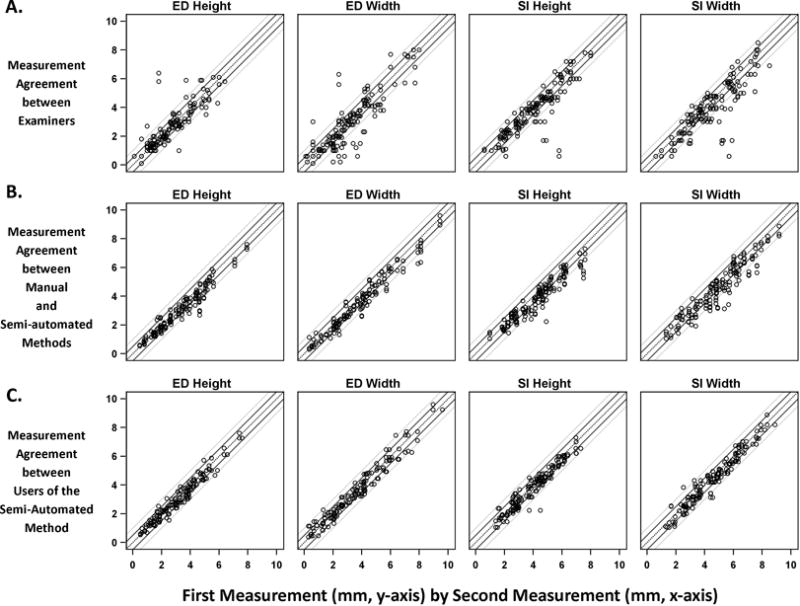
Figure 4.

Scatterplots displaying agreement in measurement of ED and SI dimensions, height and width, between a) pairs of examiners, b) manual and semi-automated segmentation methods, and c) repeated semi-automated segmentation. Note, all comparisons between pairs of examiners (E1 vs E2, E1 vs E3, E2 vs E3), manual and semi-automated segmentation (M vs A1, M vs A2, M vs A3), and repeated semi-automated methods (A1 vs A2, A1 vs A3, A2 vs A3) are represented with the same symbol on each corresponding scatterplot for ease of viewing. Reference lines for no difference (black dashed line) between two examiners and ± 0.5 mm (dark gray, solid lines) and ± 1.0 mm (light gray, solid lines) differences are displayed.
