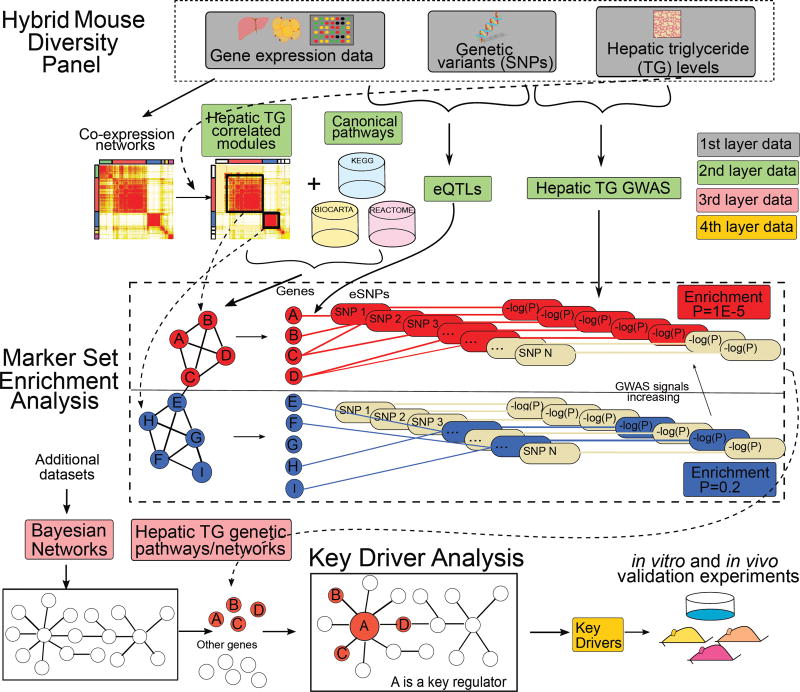
Figure 1. Schematic diagram of the methodology.
Liver and adipose tissue gene expression data, genotype, and hepatic TG phenotypic data of the Hybrid Mouse Diversity Panel (HMDP) mice were integrated to identify putative causal mechanisms for the NAFLD. TG: Triglyceride, eQTL: expression Quantitative Trait Loci; GWAS: genome-wide association studies.

