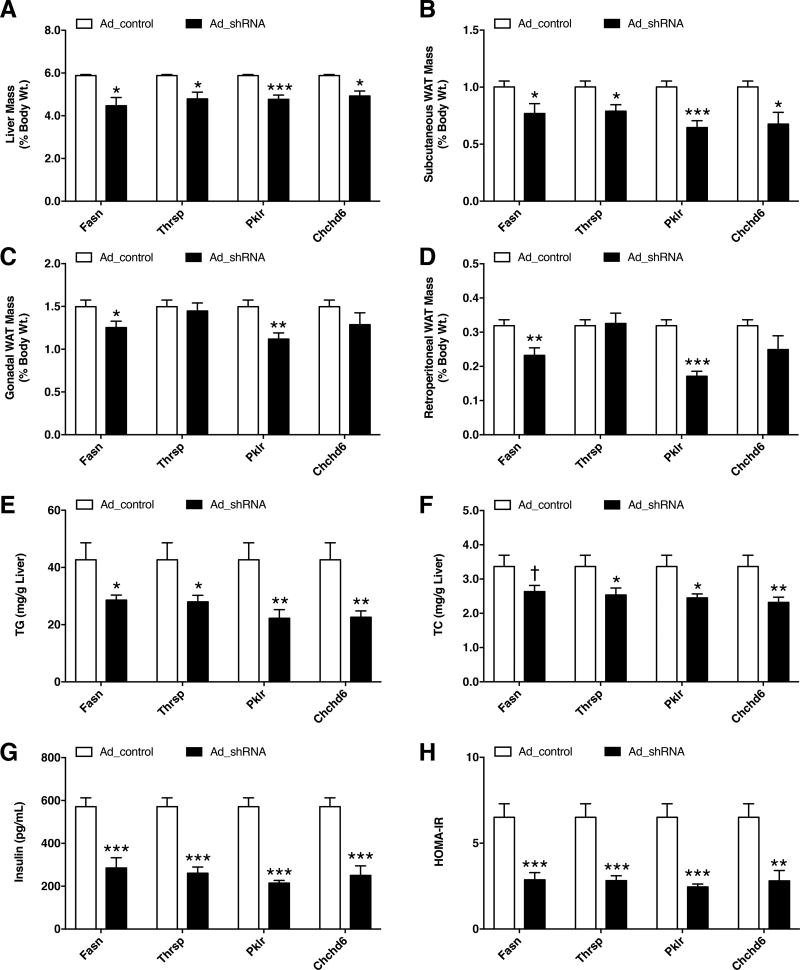
Figure 4. Effects of shRNA knockdown of KD genes on mouse phenotypes.
Eight week old C57BL/6J mice were injected with adenovirus carrying either empty vector or shRNA against respective KD genes and fed with HF/HS diet for 14 days. Comparisons of (A–D) liver and three white adipose tissue (WAT) weights, (E) hepatic triglyceride (TG) levels, (F) hepatic total cholesterol (TC) levels, (G) plasma insulin levels and (H) HOMA-IR measurements between control and shRNA animal groups. Data are represented as mean ± SEM (n = 7–12 animals per group). P values were calculated by unpaired two-sided student’s t-test. †P < 0.10, *P < 0.05, **P < 0.01, ***P < 0.001. See also Figures S3 and S4.

