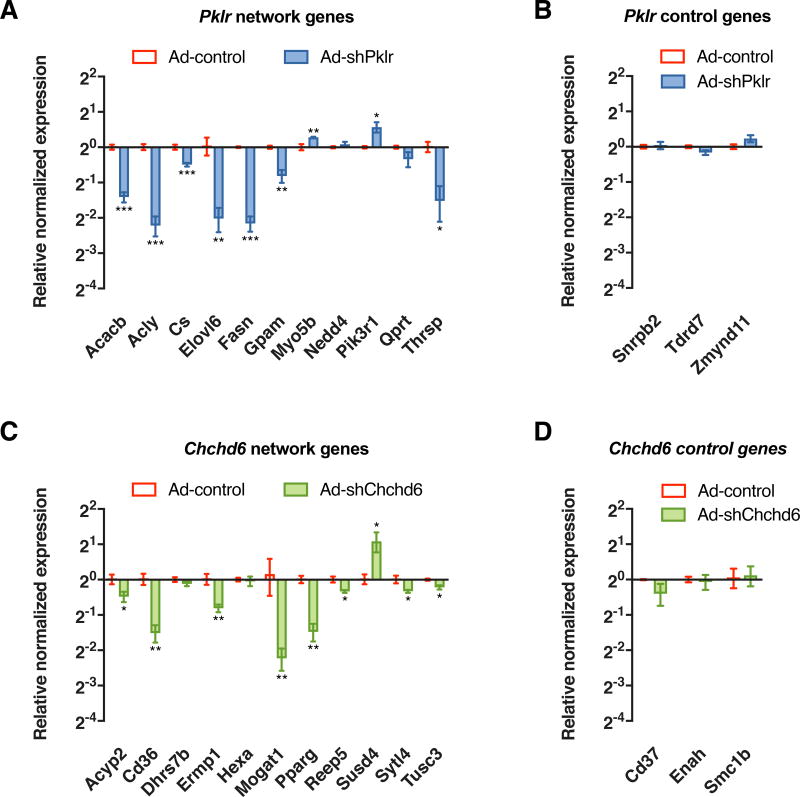
Figure 5. Effects of shRNA knockdown of predicted KD genes on network neighborhood genes.
Relative normalized expression values of neighborhood genes and distant genes (3-edges apart) of (A–B) Pklr and (C–D) Chchd6 network respectively, between control and shRNA animal groups after 14 days of infection. Data are represented as mean ± SEM (n = 4–5 animals per group). P values were calculated by unpaired two-sided student’s t-test. *P < 0.05, **P < 0.01, ***P < 0.001. See also Figure S3.

