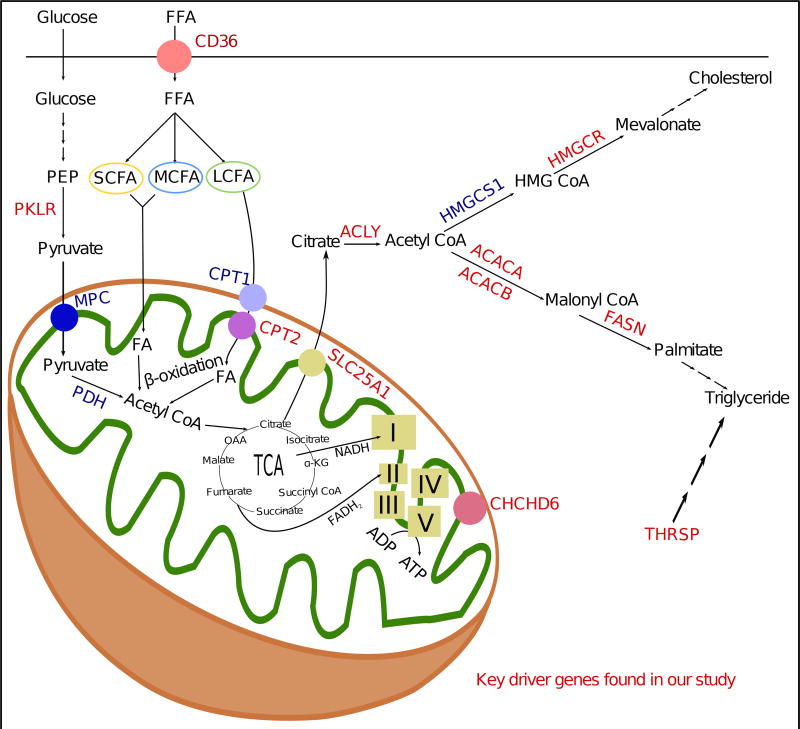
Figure 7. Summary figure illustrating that a number of KD genes are linked to mitochondrial and metabolic pathways leading to hepatic triglyceride accumulation.
KD genes including Fasn, Thrsp, Pklr and Chchd6 found in the current study are colored in red. I, II, III, IV and V correspond to respective electron transport chain (ETC) complexes. TCA: Tricarboxylic acid cycle; OAA: Oxaloacetate; FFA: free fatty acid.

