
Figure 5.
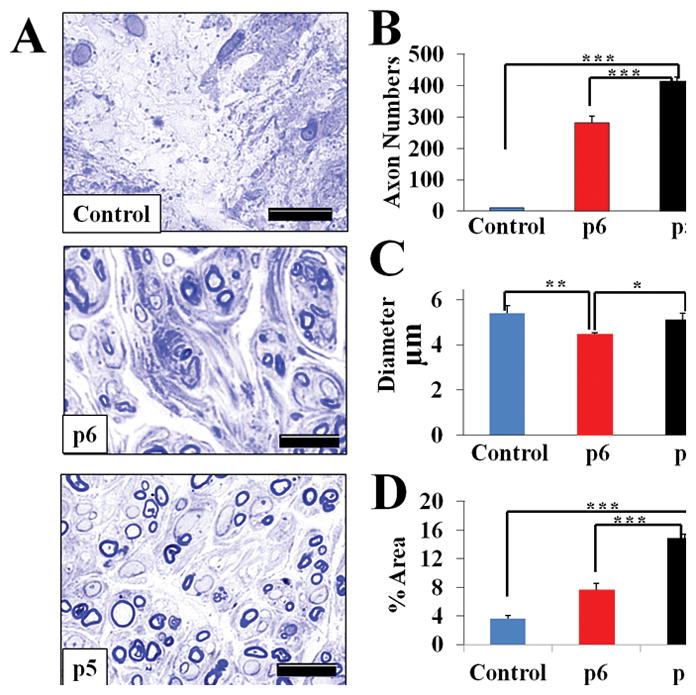
Histomorphometric analysis of the sciatic nerve regeneration. Staining with toluidine blue. (A) Representative images of cross-section of the middle part of sciatic nerve 12 weeks after repair with conduit only and injection of p5 or p6 NCSC (x600 magnification); (B) myelinated axon numbers per section; (C) myelinated axon diameter; and (D) percentage of fascicle area per section. Results presented as Mean ± SEM. Significance: *p<0.05, **p<0.01, ***p<0.001. Scale bar: 10 μm.