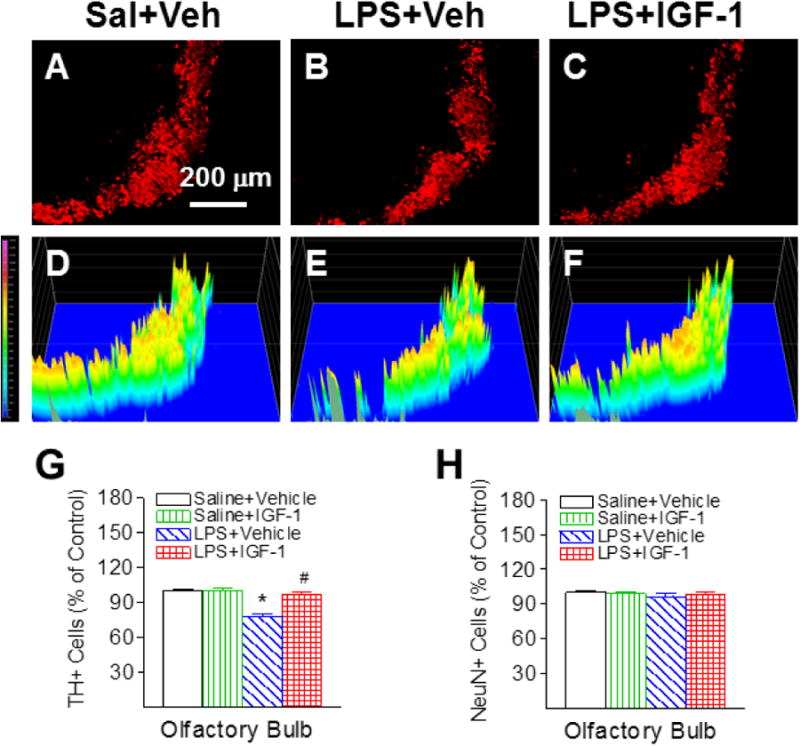
Fig. 5.

rhIGF-1 attenuated neonatal LPS-induced reduction in the number of TH+ cells in the olfactory bulb (OB) of the P21 rat brain. Representative photomicrographs of TH+ neurons in the OB region for the Saline+Vehicle group (A), the LPS+Vehicle group (B), and the LPS+IGF-1 group (C). The corresponding intensity profiles of TH expression were presented under the photomicrographs of TH+ cells in the OB region (D-F). LPS injection resulted in a loss of TH+ staining (B&E). rhIGF-1 attenuated LPS-induced loss of TH+ staining (C&F). Quantification of TH+ cells and NeuN+ cells in the OB are shown in G and H, respectively. The results are expressed as the mean+SEM of six animals in each group and analyzed by two-way ANOVA, followed by the Student-Newman-Keuls test. *P<0.05 represents significant difference for the LPS+Vehicle group compared with the Saline+Vehicle group. #P<0.05 represents significant difference for the LPS+IGF-1 group compared with the LPS+Vehicle group.
