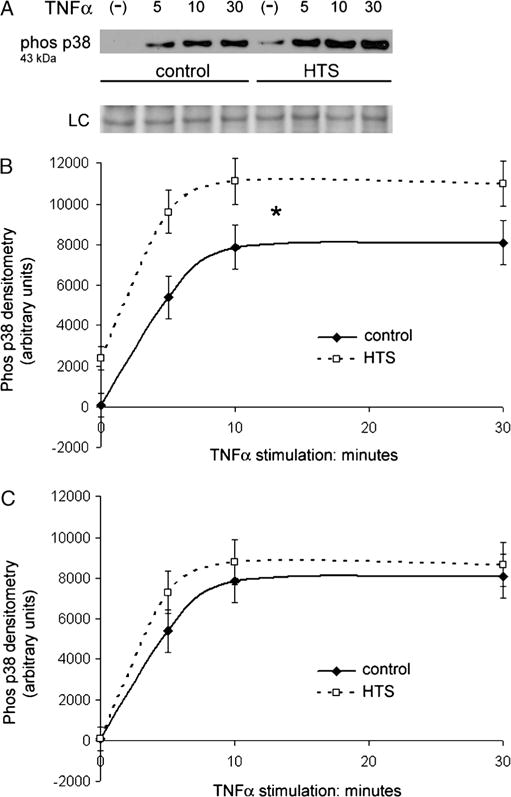
FIG. 6. TNF-α–induced p38 MAPK phosphorylation is unchanged by HTS.

A, Western blot of whole cell lysate does not find phosphorylated p38 MAPK in unstimulated cells. TNF-α provokes a marked increase in phosphorylated p38 levels at 5 min that continues to increase and plateau at 10 and 30 min. Hypertonic saline pretreatment alone before TNF-α stimulation causes a low level of p38 phosphorylation. TNF-α provokes proportional increases in phosphorylated p38 levels at 5, 10, and 30 min while in the presence of HTS. B, Densitometry data confirm that HTS alone causes a measurable increase in phosphorylated p38. At each time point, the paired groups are significantly different. However, the similarly shaped density curves show that TNF-α induces the same relative increase in both the control and HTS groups. Densitometry data of four separate experiments are averaged and presented as SEM (*P < 0.01). C, Subtracting the average densitometry value of the initial HTS-only group from the remaining HTS groups yields a curve that is identical to that of TNF-α only. The paired time points from each curve are not significantly different with overlapping error bars. Densitometry data of four separate experiments are presented as SEM.
