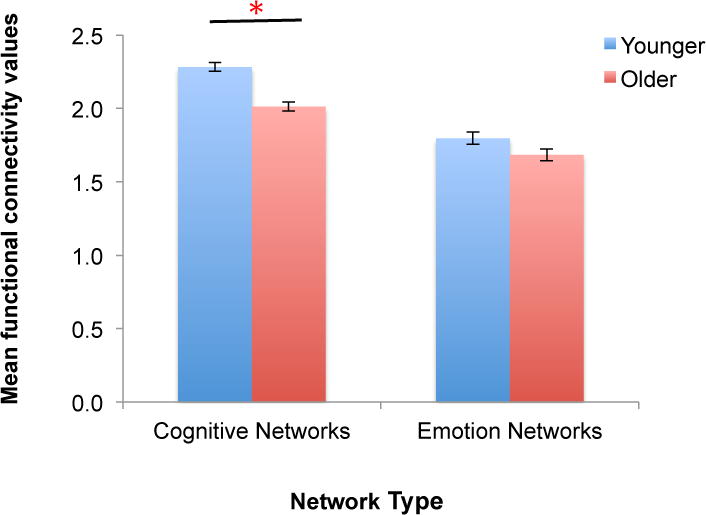
Figure 4.

Larger age-group differences in cognitive networks compared to emotion networks. Cognitive network connectivity was calculated by taking an average of functional connectivity values across all five cognitive networks (as shown in green in Figure 1). Similarly, we computed the average functional connectivity values across all three emotion networks. After controlling for sex and ICV, we found a significant age group × network type interaction. This was due to greater cognitive-network connectivity in younger adults compared with older adults with the absence of significant group difference in the emotion networks. The error bars indicate standard errors.
