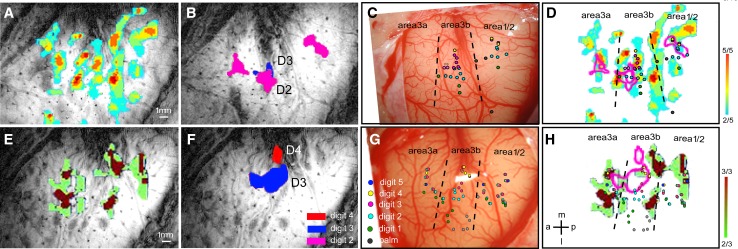
Fig. 1.
Comparison of nociceptive-heat and tactile fMRI activations within SI cortex in two representative monkeys. A, E Color-coded activation probability maps illustrate the frequency of detected activations (in each run) in response to 47.5 °C nociceptive-heat stimulation of digits within each imaging session. Activation in each run was thresholded at P < 0.0001 (uncorrected). B, F Composite digit tactile activation maps in the same animals. Letters indicate the stimulated digits associated with the activation. C, G Digit representation maps as determined electrophysiologically by microelectrode mapping. Receptive field properties of neurons at each penetration (colored dots) are color-coded for different digits. Dotted lines indicate the estimated inter-areal borders. D, H Overlays of nociceptive heat and tactile fMRI activation patterns and electrophysiological maps in each animal. Color-coded scale bars indicate the number of activated runs of the total of scanned runs (far right). a anterior, p posterior, m middle, l lateral. Scale bars 1 mm. Modified from Chen LM, et al., Pain 2011 [23].

