Fig. 3.
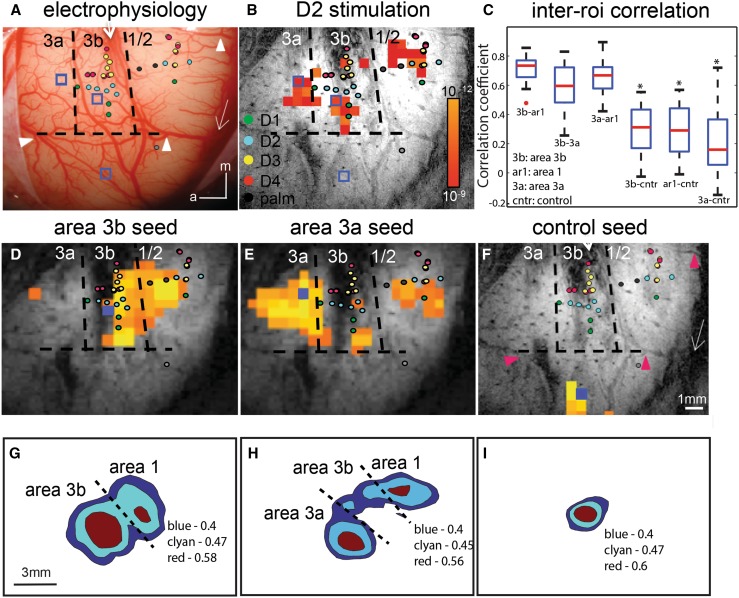
Resting-state fMRI connectivity within SI cortex of squirrel monkeys. One case is shown in A–B and D–F, and population data in C and G–I. A Electrophysiological map of digit region. Colored dots see legend, digits 1–4, palm. Dotted lines estimated borders between areas 3a, 3b, and 1, and between hand/face. White arrows central and lateral sulci. Blue boxes areas 3a, 3b, and 3b face seed regions. White arrowheads vessel markers used for alignment with image in F (pink arrowheads). B BOLD activation in response to vibrotactile stimulation of D2 tip. Activated voxels occur in areas 3a, 3b, and 1. Correlation maps were thresholded at r > 0.7 with a peak correlation value of 0.9. C Box plot of correlation coefficient values between areas 3b and 1 (3b–ar1), 3b and 3a (3b–3a), and 3a and 1 (3a–ar1), with control locations (3b–cntr, 1–cntr, and 3a–cntr). D–F BOLD correlation maps in the resting state. Seed voxels (solid blue boxes in D and E) were placed in the digit regions in areas 3b (C), 3a (D), and the face regions in 3b (F) for voxel-wise correlation analysis. G–I Cross-animal (or population) correlation maps of seeds in areas 3b (G), 3a (H), and face (I) regions. Correlations are a summary of 18 runs (i.e., each map is based on 18 seeds, seeds overlay D2, D3, or D4 digit tip) conducted in 10 animals. To average across animals, seed voxels were used to align all the cross-animal images. Correlation maps are centered on the seed region. Because the seed location is relative to the imaging field of the view across animals, there are some deviations in spatial location between the average correlation map and individual cases. Adapted from Wang Z, Chen LM, et al., Neuron 2013 [57].

