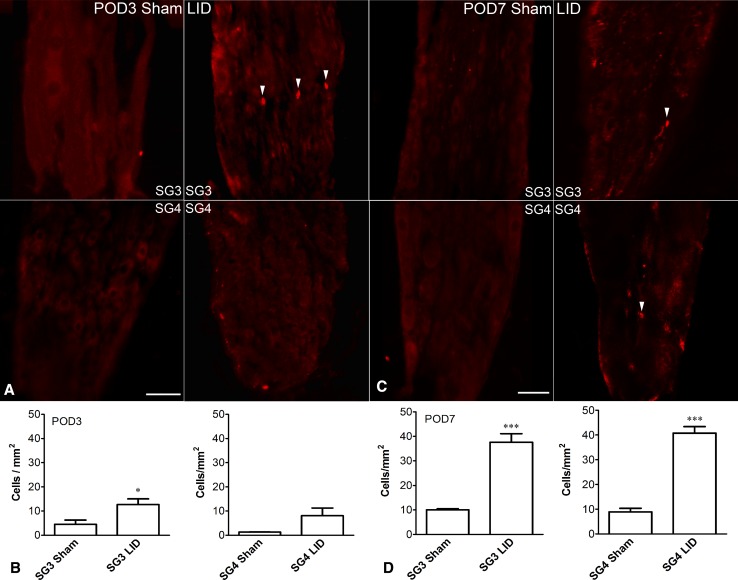
Fig. 9.
Effect of local inflammation of L5 DRG (LID) on T cell infiltration in SG3 and SG4. Sections of SG3 and SG4 at POD 3 and POD 7 immunostained with T cell receptor antibody. A Representative microimages from POD 3 animals showing a small increase in T cells after LID. B Statistics for cells/mm2 from both SG3 and SG4 sections showed only the SG3 increase reached significance. C Representative immunostaining of T cell receptor 7 days after LID. D Statistics for cells/mm2 from both SG3 and SG4 showing a significant difference between groups, but the absolute values were much smaller than those after SNL (compared with Fig. 8). Arrowheads indicate examples of individual T cells. (*P < 0.05, ***P < 0.001 between groups, t-test; n = 4 rats of either sex per group; scale bars, 50 µm).

