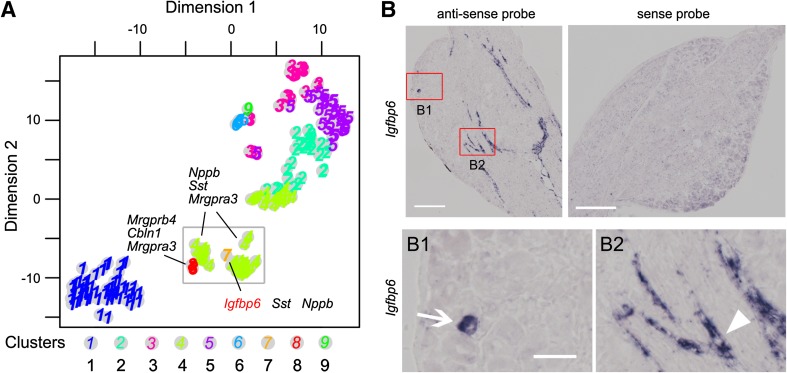
Fig. 2.
Rare cell types and subtypes of DRG neuron. A t-SNE map showing cell clusters obtained using the RaceID algorithm. The grey square shows cell cluster 7 and genes corresponding to known markers specifically expressed in the cluster. Cluster numbers are repeated in black. B Gene expression of Igfbp6 in mouse DRG shown by ISH with anti-sense probe (left). No ISH signal is detected with the sense probe (right). Enlargements show the Igfbp6 expression in a neuron (B1, arrow) and a fibroblast in a blood vessel (B2, arrowhead). Scale bars for B, 200 μm; for B1 & B2, 50 μm.

