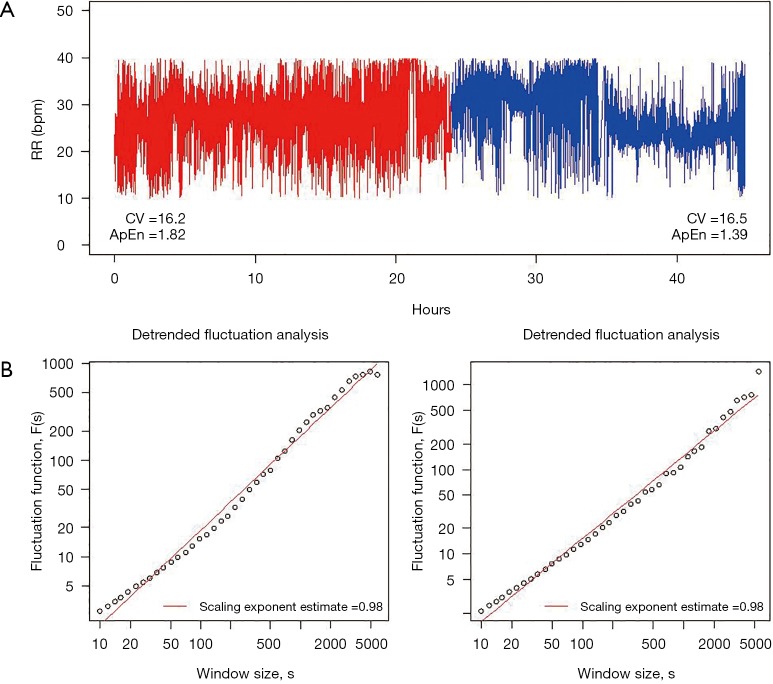
Figure 1.
Complexity of the breathing pattern. This figure shows a broad attempt to characterize the complexity of the breathing pattern through respiratory rate variability time series in a representative tracheotomized patient in our center. (A) RR during the 24 hours before (red trace) and 24 hours after (blue trace) a tracheotomy procedure. The variability was similar in the two periods; this was attributed to the value of the coefficient of variation, CV. However, approximate entropy, ApEn decreased for the post period, suggesting a time series with a less irregular (or more predictable) pattern of fluctuations; (B) the power law relationship between the fluctuation function F(s) and window size s, F(s) ~ sα, appears as a straight line with slope (i.e., the scaling exponent), α, on the log-log graph, exhibiting a 1/f fractal-like behavior in both cases. RR, respiratory rate.

