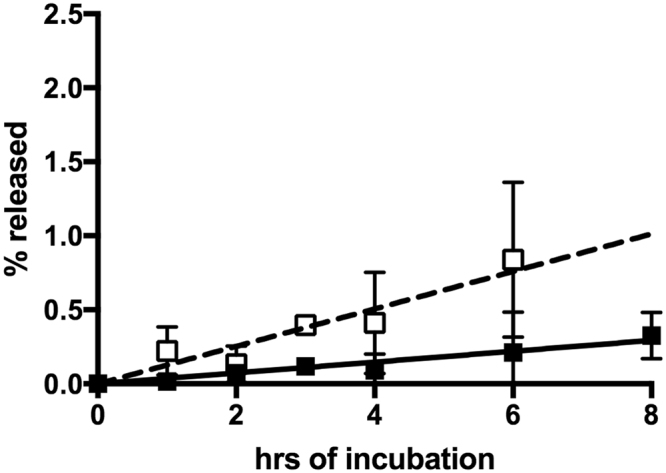
Figure 1.

Release of IDE and LDH from HEK-293 cells. HEK-293 cells were cultured in DMEM media with 10% FBS. At the time periods indicated aliquots were taken and used for Western blot analysis for IDE (■) or LDH (◻). The % released is based on the Western blot signal in the media relative to the total Western blot signal (media plus cell lysate). Indicated points are the mean of results from five independent experiments with the error bars represent +/− the standard deviation of the measurements. The lines show linear regression fits to the IDE values (solid line) or LDH values (dashed line).
