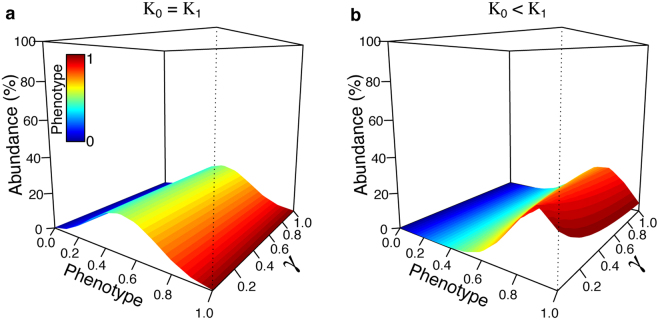
Figure 2.
Density-dependent demographic parameters influencing the landscape of observed phenotypes. The phenotypic landscape is extrapolated from the contribution of five additive genes (nL = 5). We show the effect of the absence of interspecific competition (α01 = α10 = 0) with equal or unequal carrying capacities between the two parental species (K1 = K0 or K1 = 1.5 K0). We explored various levels of interbreeding success rate, from rare hybridization success (γ = 0.01) to a panmictic mating system (γ = 1). The data corresponds to the situation after 100 generations of independent evolution and 150 generations of hybridization (250 total generations).

