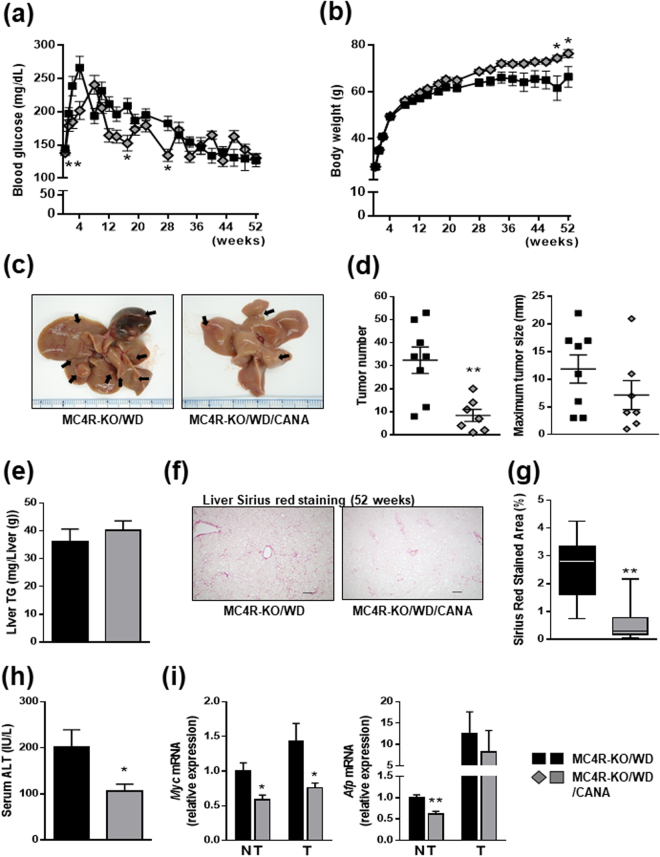
Figure 5.
CANA attenuates the development to hepatocellular carcinoma in WD-fed MC4R-KO mice. The changes in (a) blood glucose levels and (b) body weight during CANA treatment for 52 weeks. n = 8–9. (c) Representative images of livers. Arrows indicate tumors. (d) Tumor numbers and maximum size. (e) Triglyceride content of the liver tissues from non-tumor sites. (f) Sirius red staining of the liver sections and (g) quantification. (h) Serum ALT levels. (i) Expression levels of Myc and Afp genes in the liver tissues from non-tumor (NT) or tumor (T) sites. Original magnification, ×100. Scale bars, 100 μm. *p < 0.05, **p < 0.01 vs MC4R-KO/WD. Statistical analyses were performed using non-paired Student’s t (a,d,e,h and i) or Mann-Whitney (g) test. n = 7–8.

