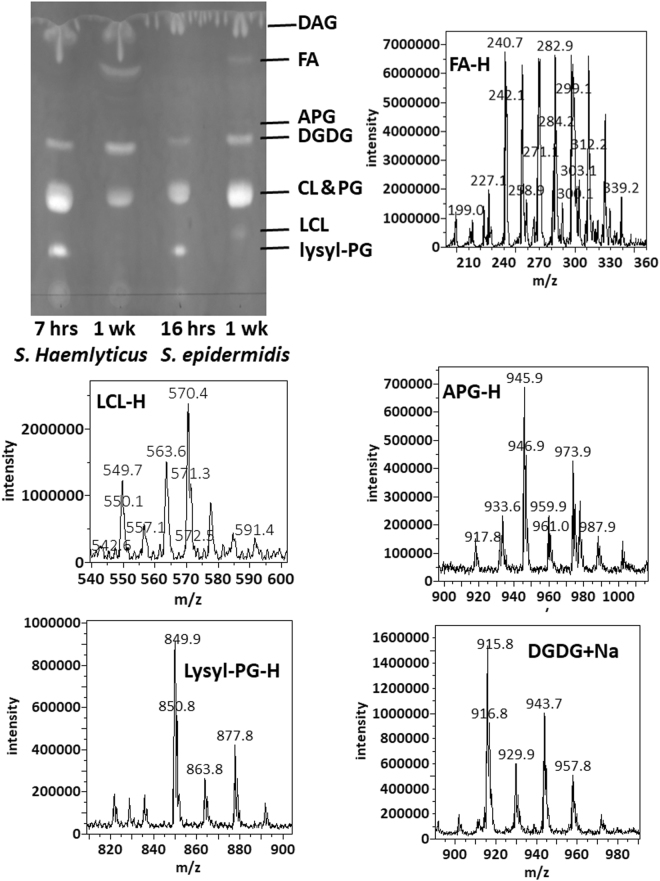
Figure 1.
Thin-layer chromatogram and mass spectra of lipids extracted from S. epidermidis and S. haemolyticus. The TLC sheet was stained with 0.02% primuline. Representative fluorescent bands were analyzed by MS. The lipid compositions are marked on the right. DAG was partially recovered from the solvent front. Mass spectra in recovered lipids from representative TLC bands are shown. CL migrated slightly faster than PG, but not enough to separate the two types of lipids by TLC.

