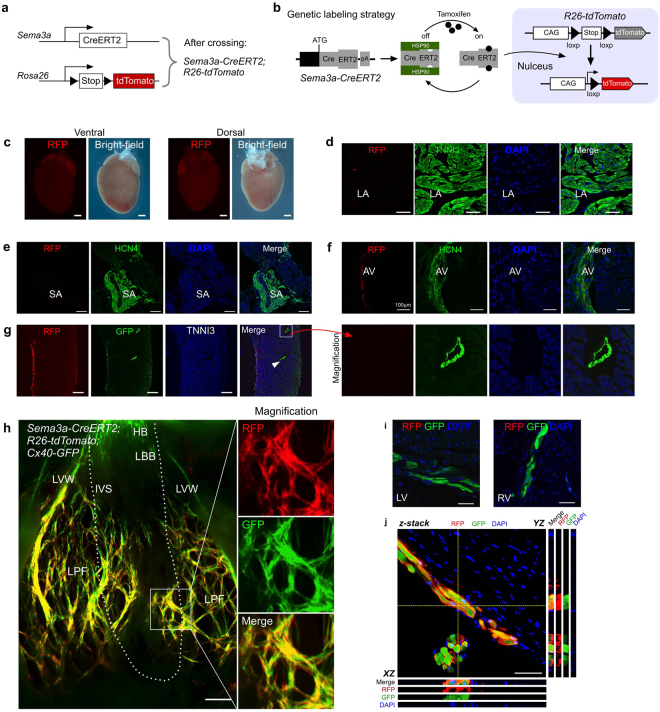
Figure 2.
The adult expression map of Sema3a in the heart. (a) Schematic showing the crossing of the mice to generate the Sema3a-CreERT2; R26-tdTomato mice. (b) Genetic labelling of the Sema3a+ cells via tamoxifen administration. (c) Whole-mount fluorescence and bright-field views of a Sema3a-CreERT2; R26-tdTomato mouse heart. (d) Immunostaining for RFP and TNNI3 on a Sema3a-CreERT2; R26-tdTomato heart section showing the rarity of RFP+ cells in the atrium. LA, left atrium. (e) No Sema3a+ cells were detected in the SA node. (f) The expression of Sema3a in the AV node. (g) Immunostaining for RFP, GFP and TNNI3 in a Sema3a-CreERT2; R26-tdTomato; Cx40-GFP mouse heart section showing that the CX40+ coronary artery (arrowhead) was negative for RFP. (h) Whole-mount fluorescence view of a Sema3a-CreERT2; R26-tdTomato; Cx40-GFP mouse heart. LBB, left bundle branch; LPF, left Purkinje fibre; IVS, interventricular septum; LVW, left ventricular free wall. The dotted line indicates the limits between the IVS and the LVW. (i) Immunostaining for RFP and GFP on heart sections of a Sema3a-CreERT2; R26-tdTomato; Cx40-GFP mouse. Sema3a was not detected in the LBB or RBB, which were positive for Cx40-GFP. (j) Z-stack confocal image showing that Sema3a was expressed in the Purkinje fibres. XZ and YZ indicate the signals from the dotted lines on the Z-stack images in (j). Scale bars, 1 mm in (c) 500 µm in (e,g,h) and 100 µm in (d,f,i) and (j). Each image is representative of 5 individual samples.

