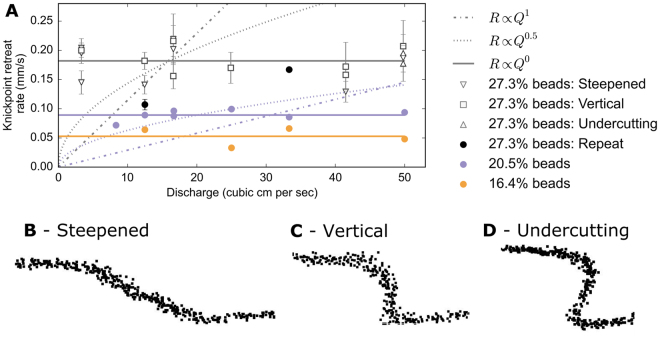
Figure 3.
(A) Relationship between knickpoint retreat rate and discharge for the experiments using three different silica mixes. For the mix with 27.3% spherical beads, the knickpoint retreat rate is plotted according to the knickpoint geometry: steepened reach (circles, typical form shown in B), or waterfalls with either (i) vertical faces (squares, shown in C) or (ii) undercutting plunge pools (triangles, shown in D). Mean retreat rates are given for different geometries during the same experiment where a knickpoint demonstrated the same geometry for at least four consecutive point clouds (error bars corresponds to 2 standard deviations of the retreat rate). The long term retreat rate is shown for the mixes with 20.5 and 16.4% spherical beads. The relative cohesion of the paste (set by the proportion of spherical beads) has a clear control on the knickpoint retreat rate, but there is no increase in knickpoint retreat rate, despite an order of magnitude increase in discharge for experiments with the same cohesion. Superimposed on the plot are the potential relationships expected according to the stream power incision model (R ∝ Q0.5 or R ∝ Q1); the experimental data here are best described when R ∝ Q0.

