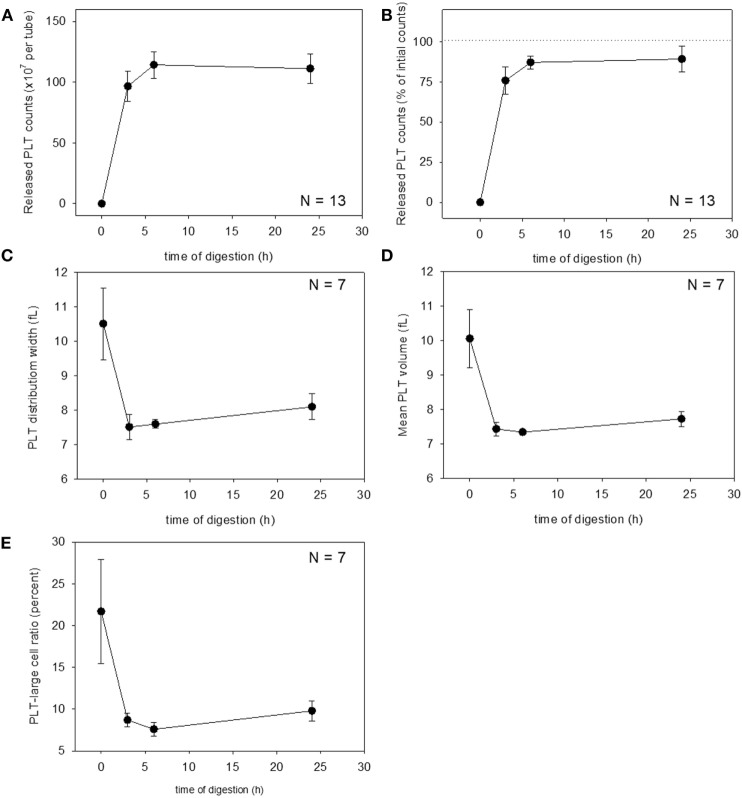
Figure 3.
Digestion time–dependent changes in platelet counts and platelet parameters. Total platelet counts released from a platelet-rich plasma-FM as a raw number (A) and a percentage (B) (N = 13). Platelet distribution width (C), mean platelet volume (D), and platelet–large cell ratio (E) of the released platelets (N = 7).

