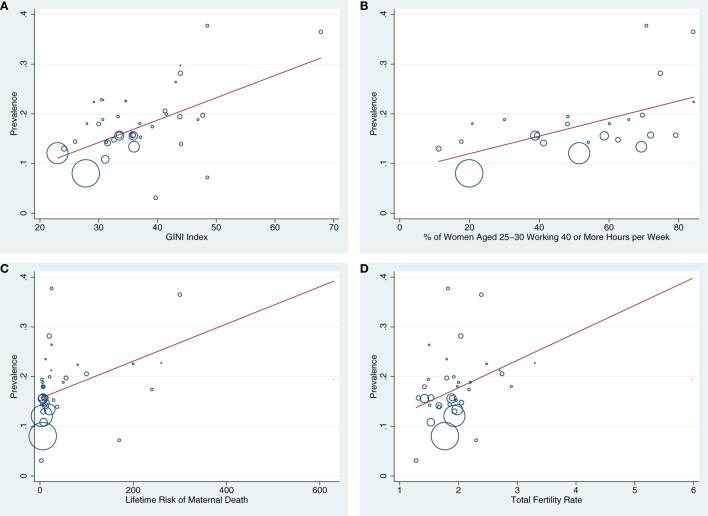
Figure 4.
(A–D) Bubble plots are presented showing the associations between GINI index (A), % of women aged 25–30 working ≥40 h a week (B), lifetime risk of maternal death (C), and total fertility rate (D) with national postpartum depression (PPD) prevalence. Countries with larger bubbles had larger sample sizes and were weighted accordingly in meta-regression models.

