Figure 3.
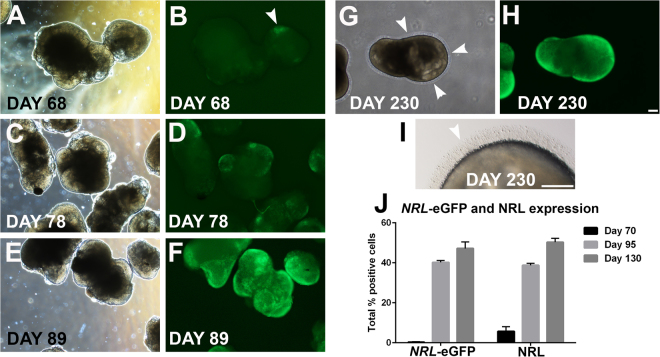
Observing rod production in live NRL+/eGFP OVs. Phase and epifluorescence images of live NRL+/eGFP OVs were obtained over time in live cultures. (A,B) Small patches of NRL-eGFP were detected beginning at d68 (arrowhead in B). (C–F) NRL-eGFP fluorescence increased from d78 (C,D) to d89 (E,F), by which time all OVs demonstrated robust NRL-eGFP fluorescence. (G,H) NRL-eGFP fluorescence is maintained to at least d230, the last time point examined. (G,I) Hair-like outer segment projections are formed along the outside of OVs (arrowheads). (J) To quantify the number of NRL-eGFP+ and NRL+ cells, dissociated OVs were plated and immunolabeled with an anti-NRL antibody. The number of NRL-eGFP+ and NRL+ cells increased dramatically and concomitantly from d70 to d95. At d130, roughly half of all cells within OVs were immunopositive for NRL-eGFP and NRL. Scale bar in H = 100 µm (applies to A–H); I = 50 µm.

