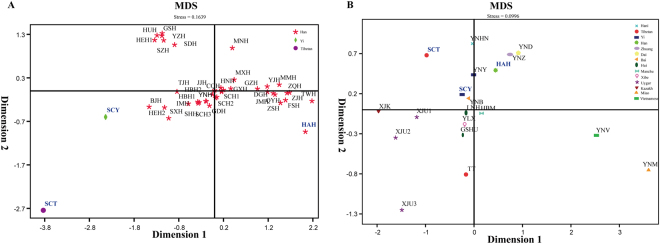
Figure 2.
Multidimensional Scaling plots (MDS) constructed based on Nei’s genetic distances calculated by allele frequency distributions of 19 overlapped autosomal STRs. (A) MDS of our studied populations (bold and blue) and 40 reference Chinese Han populations (the information of abbreviations are presented in Supplementary Table 12). (B) MDS of our studied populations (bold and blue) and 16 reference ethnic minorities (the information of abbreviations are presented in Supplementary Table 12).

