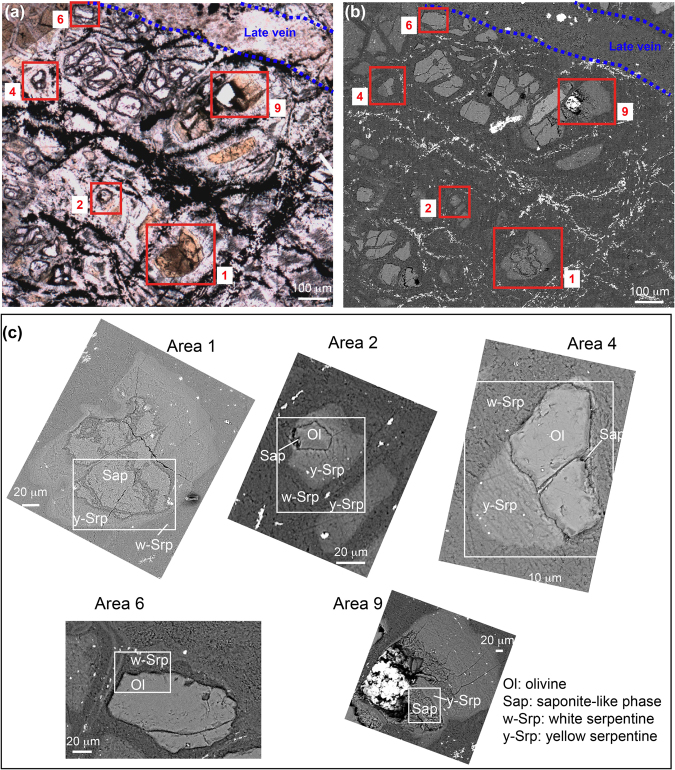
Figure 1.
(a) Optical microscopy and (b) SEM observations of the analysed serpentinized peridotite showing with red rectangles the 5 areas that were considered for PCA and MCR-ALS analysis (numbered Areas 1, 2, 4, 6, 9) along with a late vein crosscutting the sample. (c) Enlarged SEM views of the 5 selected areas. White rectangles show locations of S-FTIR hyperspectral images displayed in Fig. 2. The bright zone in Area 9 corresponds to a hole resulting from the removal of an olivine crystal during polishing. SEM images were acquired in backscattered mode between 10 and 15 kV and under high vacuum conditions.

